Hero photo / VR footage (to be added)
R&D & Battery Recycling
Engineering non-destructive lithium-ion battery recycling
Most recycling today discards the cathode's crystal structure to recover the metals; direct recycling avoids this by relithiating the structure in place instead.
See the technology comparisonIn active R&D, not yet commercialized
The battery industry's growth is often framed as an unambiguous climate win. The manufacturing and end-of-life reality is more complicated: virgin active material is mined and refined globally, and the two conventional recycling routes in wide use today, pyrometallurgical smelting and hydrometallurgical leaching, are themselves energy- and reagent-intensive, and both destroy the cathode's crystal structure to get at the metals inside it.
Partner with usTechnology overview
Three recycling routes, compared
A literature-based comparison of the two conventional routes against direct recycling, the approach HSCR is engineering.
| Feature | Pyrometallurgical | Hydrometallurgical | Direct Recycling |
|---|---|---|---|
| Lithium recovery | 0–10% (lost to slag) | 90–95% | 95–99% |
| Manganese recovery | 10–20% (mostly to slag) | 90–95% | n/a (retained in the active material) |
| Feedstock tolerance | High (mixed/low-purity feed OK) | Medium (needs sorting) | Low (needs high-purity input) |
| Energy intensity | ~2–4 kWh/kg feed (furnace) | ~0.3–0.6 kWh/kg feed | ~0.4–0.7 kWh/kg feed |
| Cathode crystal structure | Destroyed | Destroyed | Preserved (relithiated in place) |
Based on published literature. HSCR's own process is in development; process-specific performance data will be published once verified. Cf. Roy et al., Carbon Energy, 2024, on the energy and reagent intensity of conventional recycling routes.
Process flow
The same six pretreatment steps. Then a very different path.
Built from our internal process model (Sheets 2–7): every route starts with the same collection-to-black-mass pretreatment. What happens after that is where direct recycling's advantage comes from.
Shared pretreatment: every route starts here
- 01Collection & discharge
- 02Dismantling (casing / BMS)
- 03Electrolyte removal
- 04Shredding
- 05Delamination & classification (foil vs. active-material separation)
- 06Binder removal → black mass
then the routes diverge
Pyrometallurgical
12 steps total- 07Carbothermic smelting (furnace)
- 08Alloy re-leach (acid dissolution)
- 09Impurity removal
- 10Solvent extraction
- 11Precursor co-precipitation
- 12Lithiation & calcination
New cathode, Li/Mn mostly lost to slag
Hydrometallurgical
11 steps total- 07Acid leaching (H₂SO₄ + H₂O₂)
- 08Impurity removal
- 09Solvent extraction
- 10Precursor co-precipitation
- 11Lithiation & calcination
New cathode, structure rebuilt from scratch
Direct Recycling
8 steps total- 07Cathode AM isolation (binder & conductive-carbon residue removed)
- 08Relithiation (Li dosing, no dissolution)
Regenerated cathode, structure preserved
Step counts are process stages from our internal techno-economic model (Sheets 2–7), not a timing or cost claim. Pyrometallurgical smelting still requires the same acid-leach and re-synthesis chain as hydrometallurgy for its alloy output, which is why it has the most stages of the three rather than the fewest. Direct Recycling carries one step Pyro/Hydro don't need: isolating pure cathode active material from graphite, binder, and conductive carbon before relithiation, because it needs a high-purity feed where the other two routes can process the whole black mass together.
What's actually being preserved
Structure, at the atomic scale
Molecular-dynamics simulations from the founder's own research, the same class of atomistic modeling used to understand why structure-preserving recycling is chemically different from dissolve-and-resynthesize.
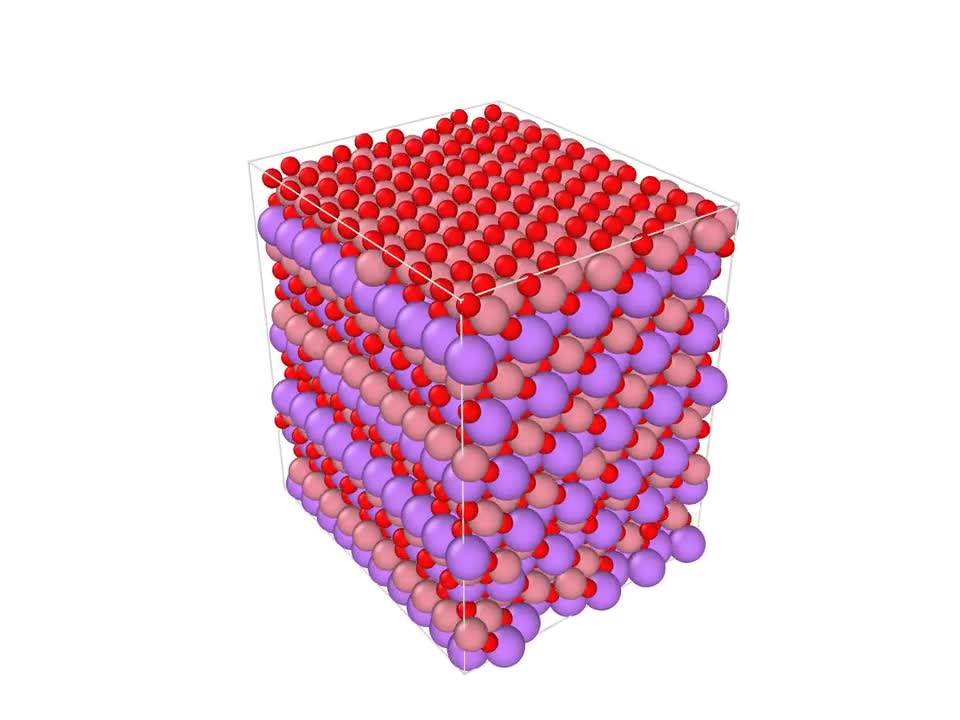
The cathode's layered crystal structure
A molecular-dynamics view of a layered oxide cathode lattice, the ordered structure that took significant energy to build in the first place, and the thing leaching and smelting both break apart to get at the metals.
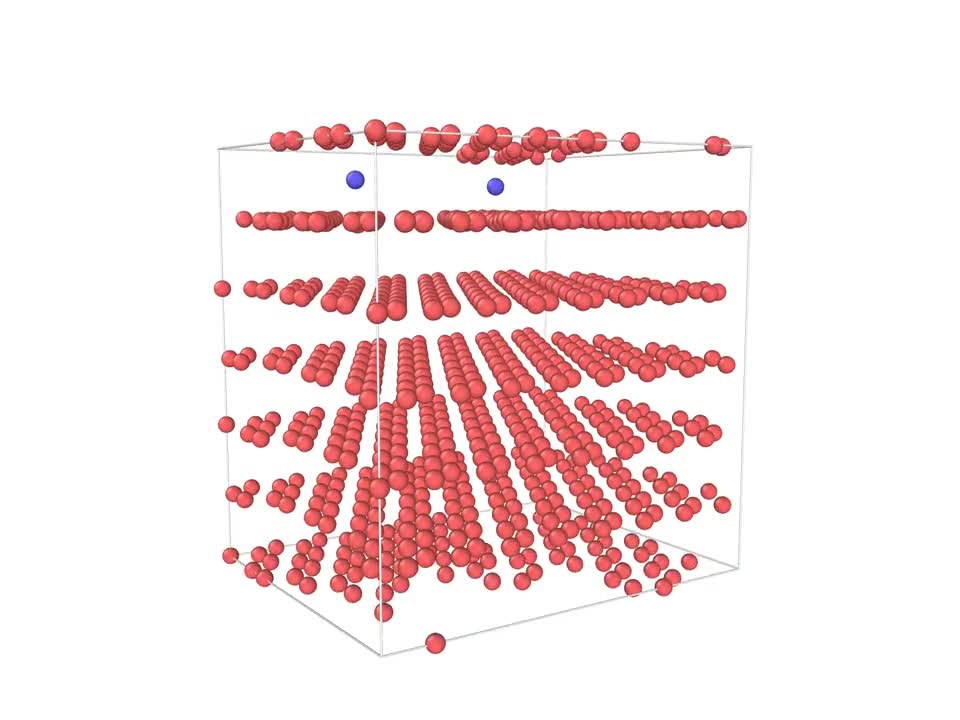
Lithium intercalating between graphite layers
A lithium ion moving into a graphite anode lattice during charge, the same layered-insertion mechanism direct recycling relies on to redose lithium back into a degraded cathode without dissolving it first.
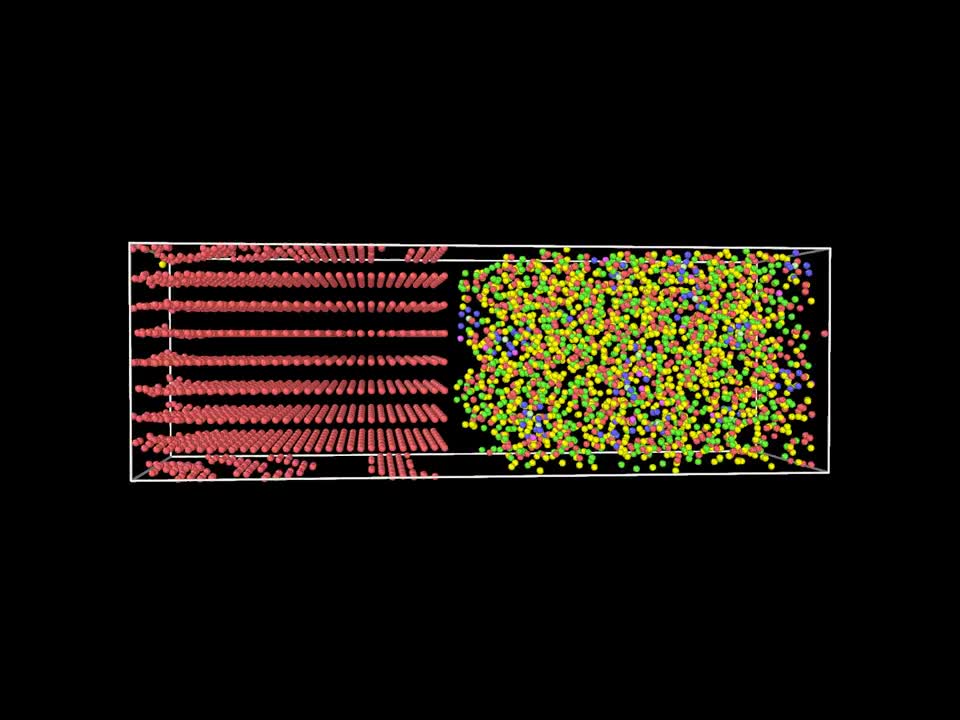
Anode–electrolyte interface
A graphite anode lattice alongside the surrounding electrolyte species, the same class of atomistic modeling (ReaxFF MD) used to study how these materials behave, rather than treating them as an undifferentiated feedstock stream.
Why this matters
What the model projects
Modeled techno-economic estimates for HSCR's own process, from a worked example run of our internal model.
≥ 99%
Battery-grade purity achieved (modeled, NMC batch)
≥ 98%
Battery-grade purity achieved (modeled, LFP batch)
≈ $13/kg (modeled)
Net value modeled per kg of feedstock processed (NMC)
≈ $8/kg (modeled)
Net value modeled per kg of feedstock processed (LFP)
Feedstock
What we accept
Chemistries accepted
Formats accepted
Status
IP and regulatory status
Patent & IP status
Proprietary process. Patent filing in preparation. IP protection in progress.
Regulatory status
Regulatory and environmental authorizations (e.g. state pollution-control board approvals) will be pursued once the process is finalized.
Lab capability
Facility details to follow.
Compare the routes
Run your own feedstock through all three routes
Enter a feed mass and chemistry to see step count, recovery, energy intensity, and modeled net value side by side for Pyrometallurgical, Hydrometallurgical, and Direct Recycling.
Pyrometallurgical
12 steps- Li recovery
- 0–10% (lost to slag)
- Mn recovery
- 10–20% (mostly to slag)
- Feedstock tolerance
- High (mixed/low-purity feed OK)
- Final purity
- n/a (alloy output feeds back into hydrometallurgical re-leach)
- Energy intensity
- 2–4 kWh/kg feed
Net value, per kg feed
Route-dependent, not modeled for NMC in our worked example (Pyro wasn't routed in this run either).
Hydrometallurgical
11 steps- Li recovery
- 90–95%
- Mn recovery
- 90–95%
- Feedstock tolerance
- Medium (needs Sheet 1B sorting)
- Final purity
- ≥98% target
- Energy intensity
- 0.3–0.6 kWh/kg feed
Net value, per kg feed
$13.11/kg
Direct Recycling
8 steps- Li recovery
- 95–99%
- Mn recovery
- n/a (retained in the active material)
- Feedstock tolerance
- Low (needs high-purity input)
- Final purity
- 90–97% (method dependent)
- Energy intensity
- 0.4–0.7 kWh/kg feed
Net value, per kg feed
Route-dependent, not modeled for NMC in our worked example.
Partnership inquiries
Start a conversation
Co-development, technology licensing, feedstock partnerships, and investment inquiries: tell us which one applies.
Work on this with us
There's a live remote research-internship role on this work: Research Intern: R&D, Lithium-ion Battery Recycling.
FAQ